Energy Data Mining Analysis and Toolset
Energy Data Mining is the extraction of implicit previously unknown and potentially useful information from energy data. It uses machine learning, statistical and visualization techniques to discover and present knowledge in a form that is easily comprehensible. It is both descriptive and predictive and is an effective tool to understand performance of and opportunities in energy systems.
Graphet Data Mining has developed algorithms for clustering, regression, classification and association rule mining for analyzing energy data. Energy data mining helps our customers in the following ways:
- Uncover previously unknown and potentially useful relationships in data, thus improving the understanding of the equipment & system operations
- Identify usage patterns and sustained modes of operation for the equipment and systems which in turn gives a good foundation for modeling, estimating and calculating energy requirements of the systems
- Track and predict energy usage using key indicators like weather and production units/volume.
- Provide an objective, rigorous, consistent and repeatable approach for analyzing data.
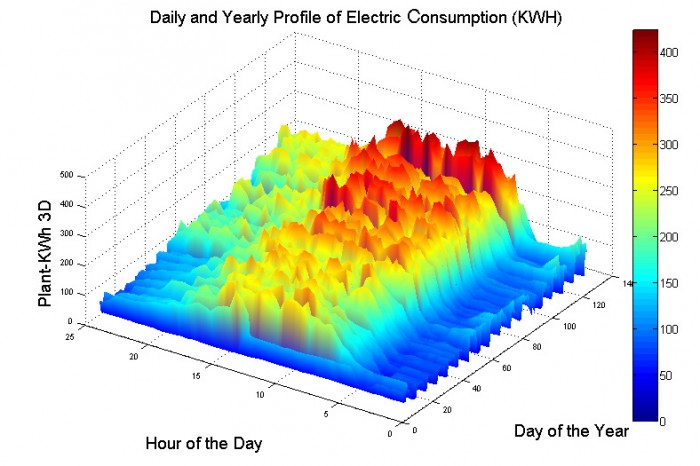
Finding Usage Patterns and Profiles in Energy Usage Data
Though plants typically collect large amounts of time series data, appropriate tools and resources to analyze this data may not always be available. Our analysis uncovers typical patterns and modes of operation and detects critical events in the system. A simple example: identifying typical patterns in daily, weekly, weekday, weekend or yearly electric consumption. A more complex example: identifying operating modes such as fully loaded, unloaded, modulating, etc., for a compressor.
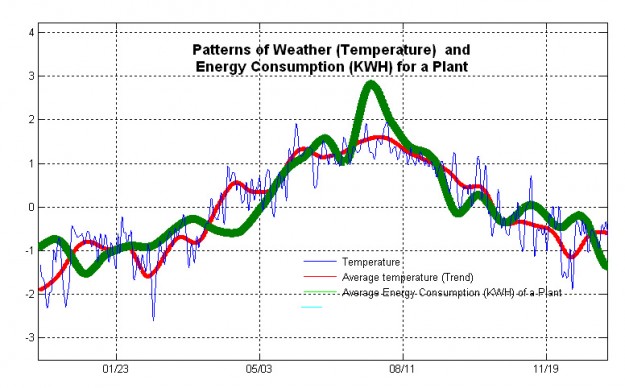
Development of Metrics/Key Indicators to Predict and Track Energy Usage
Using multivariate analysis, we explore relevant correlations between energy, key volume indicators, weather and other metrics which impact energy. A mathematical energy baseline model not only results in understanding of your energy usage and variation, but also helps to track your manufacturing processes on a day-to-day basis for any unusual energy usage. Such a model can also be used for budgeting and planning purposes.
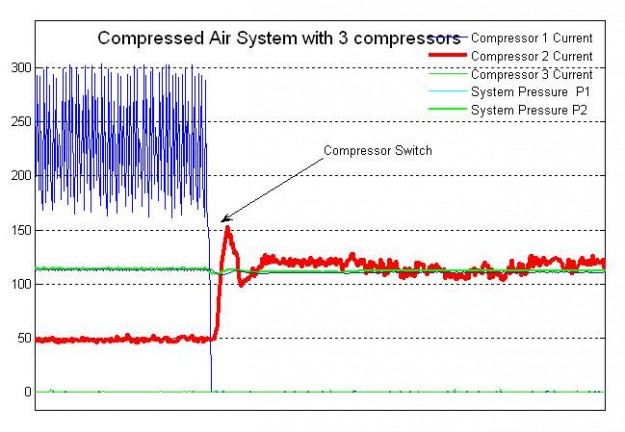
Identify Sustained Stable Modes of Operation for Equipment and System
For a system, we identify all the stable modes of operation from the monitored data and develop a baseline energy model. Below is an example of a compressed air system with multiple stable modes of operation shown in different colors.
Data Visualization and Plotting for Large Data Sets
At Graphet Data Mining, we can work with large datasets and easily visualize and plot the system parameters for analysis. This is possible by using MATLAB as our development platform. We work with various formats of time series data (excel, csv, delimited, html, xml, pdf, etc.), convert them to our proprietary format and store them in our data warehouse. We also generate animations of system performance from monitored data.